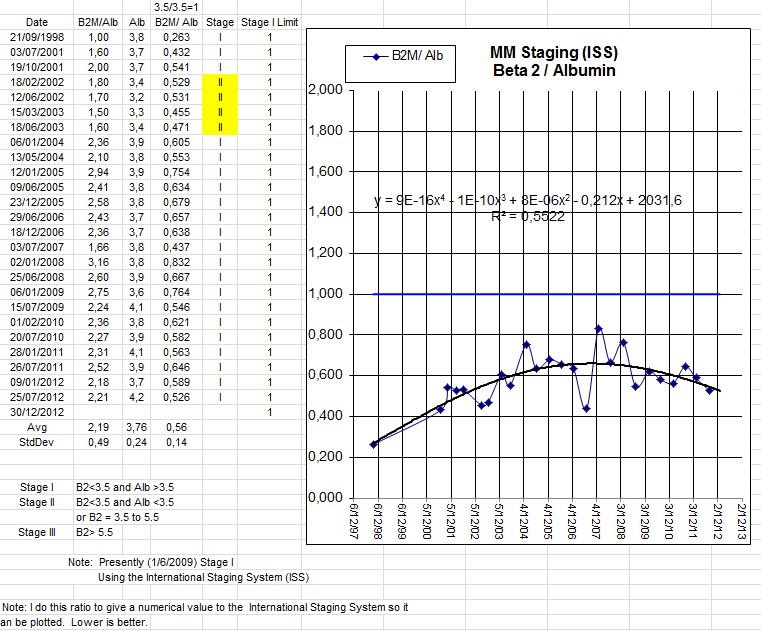
Mainly for reasons of space, I decided to post only one of TAB’s graphs. I chose this particular one because it shows his data in reference to the International Staging System, or ISS (see http://goo.gl/ycu7K for more info on this myeloma staging system, courtesy of the IMF). As you can see, TAB’s ISS trend is a downward one, which is excellent, of course!
And now let’s finally have a quick look at what I’ve been calling Plan B. In a nutshell, back when I was having all that technical trouble (all resolved now, btw…in fact, I have just been awarded the coveted title of “Summer 2012 Fastest Converter Wizardess” 😉 ), TAB informed me that he set up a public e-mail address that you can use to get in touch with him directly. Purrrrrfect. So, if you have any questions for TAB or would like to see more of his graphs etc. etc. etc., all you have to do is write to him here: tabbat841@hotmail.com.
A few more comments:
- Looking at TAB’s graph, the Stage I limit is 1,000, where the blue line is.
- B2M means Beta-2 microglobulin; Alb = albumin. These are the two markers used in the ISS.
- I had to edit the graph a bit so that it would fit better on the screen, which means that it looks a bit more squished up compared to the original. But if you click on the graph, it should appear a bit LARGER in a separate window. Then just click on the “back” arrow to return to my blog.
- Don’t miss the fact that in 2002-3, TAB slipped into Stage II (highlighted in yellow). Then he went back to Stage I, where he has remained.
Okay, I think that’s about it!!! Except, of course, that I’d like to thank TAB for his kindness and his patience! 🙂
